A Step-by-Step Guide to Creating a Power BI Dashboard

Data visualization has grown to become an integral part of our work lives, be it personal or corporate. Data visualization has got immense possibilities: it can simplify the most complex facts and figures and transform raw data into useful business insights. Microsoft’s data visualization suite, Power BI comes as a handy tool, easing up data operations and making decisions. One of the distinguishing features of Power BI service is its dashboard.
A Brief Introduction
A Power BI dashboard is a single page visualization that can be configured to display key metrics for analytics, insights and more. The dashboard also known as canvas, visualizes only the highlights of a story. The details can be analyzed in the related reports.
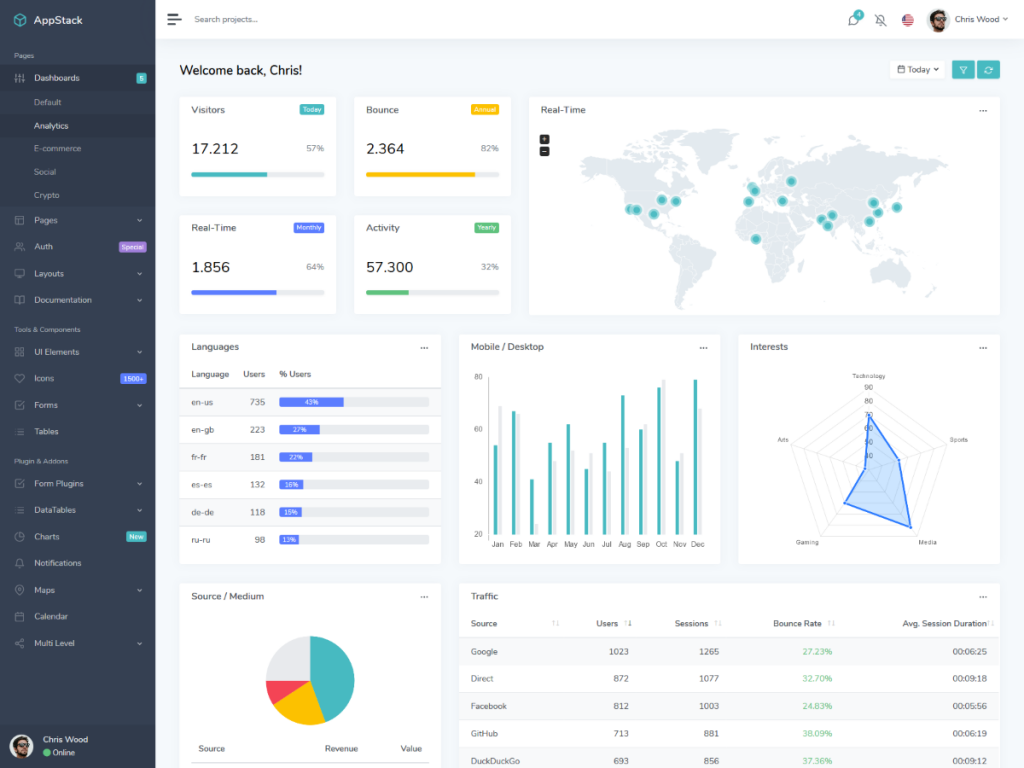
Image Source: https://docs.microsoft.com/en-us/power-bi/service-dashboards
Dashboards are a feature unique to Power BI service alone, and not available on Power BI Desktops. Also, you can view and share your dashboards on mobile devices, but not create them on mobile.
● Basic Concepts
A Power BI dashboard is actually a well knit set of tiles, which you can selectively pin to your dashboard. And each report is based on a dataset. You can think of dashboards as a connection to the reports and datasets in the backend. Clicking on one visualization guides you to the report in the backend and you can update the dataset to see changes update automatically to your dashboard.
● Advantages of Dashboards
Dashboards aren’t just about seeing your data in a pretty way, but it is about being interactive and updating tiles as and when the backend data changes.
Dashboards are a wonderful way to monitor any system, be it machine performance or business insights, by keeping only the key metrics in view. The dashboard visualizations are not limited to one data set, but can be based upon multiple data sets and reports. Regardless of whether the data is stored on cloud or on-premises, a dashboard can combine both kinds of data to provide a consolidated view.
A Step-by-Step Guide to Power BI Dashboard
Now that we know how data-driven a Power BI Dashboard can be towards gaining business insights along with dashboard basics, let’s dive right in! Here is the ultimate step by step Power BI dashboard building guide.
STEP 1: Importing from workbook
In the first step of our Power BI dashboard guide, we import a sample Power BI dataset and use it to create our own custom dashboard. Our sample dataset is an Excel Workbook with two sheets. On importing the workbook in Power BI, it adds a dataset along with a report to our workspace. The report is created automatically using the Excel sheets.
- You can use your excel file you want to build reports on.
- Next, open app.powerbi.com on your favourite browser to start using Power BI service.
- Move onto the navigation pane, and select My Workspace and then Get Data.
Image Source: https://docs.microsoft.com/en-us/power-bi/service-dashboard-create
- Go to the Files menu, then select Get.
Image Source: https://docs.microsoft.com/en-us/power-bi/service-dashboard-create
- Navigate to the location where you have stored your sample Excel dataset file. Select it and choose Connect.
Image Source: https://docs.microsoft.com/en-us/power-bi/service-dashboard-create
- For this exercise, select Import.
Image Source: https://docs.microsoft.com/en-us/power-bi/service-dashboard-create
- If everything goes right, you should see the success message appear on your window, Select the X to dismiss it.
Image Source: https://docs.microsoft.com/en-us/power-bi/service-dashboard-create
STEP 2: Pinning tiles to your dashboard
- Working on the same workspace as created in Step 1, select the Reports tab, and then select the Report you want to open.
Image Source: https://docs.microsoft.com/en-us/power-bi/service-dashboard-create
The report, by default, opens in the Reading view. Each tab on the left of the worksheet should represent a page of the report.
- To open the report in Editing view, select More Options(…) > Edit report.
Image Source: https://docs.microsoft.com/en-us/power-bi/service-dashboard-create
- Hover your cursor over any visualization to reveal the options available. To add a visualization to your dashboard, select the Pin icon.
Image Source: https://docs.microsoft.com/en-us/power-bi/service-dashboard-create
- In order to create a new dashboard, select the New Dashboard option and give it a name.
Image Source: https://docs.microsoft.com/en-us/power-bi/service-dashboard-create
- On selecting the Pin option, Power BI creates a new dashboard in your current workspace. After the successful Pinned to dashboard message appears on the screen, select Go to dashboard. If prompted in between to save the report, choose Save.
Image Source: https://docs.microsoft.com/en-us/power-bi/service-dashboard-create
Power BI should then open up a new dashboard. It has one tile containing the visualization you just pinned.
Image Source: https://docs.microsoft.com/en-us/power-bi/service-dashboard-create
- Finally, select the tile to return to the report. Pin a few more tiles as per your need to the newly created dashboard. Every time the Pin to dashboard window appears, select Existing dashboard and then Pin.
STEP 3: Choosing the right chart
Now that you have created your own dashboard, it’s time to customize your charts on the basis of the kind of data you are using to gain insights upon. This is a significant step, and if not considered properly, your data visualization may turn misleading.
Image Source: https://www.mytechlogy.com/upload/by_users/Lynia/271803074943chartcategory.png
The following few strategies might prove helpful:
There are mainly 4 classifications of charts based on their functionality:
- Comparison
- Composition
- Distribution
- Relationship
The types of charts that prove the best suitable for portraying these classifications of data are:
- Pie Charts may be used to display composition in terms of percentage. One important note here is that the values should sum to a perfect 100%
- Bar charts and column charts are one of the most commonly used chart types for showing distribution and comparison. You can display the number of products sold for each type on a bar chart. This may also be used to establish a comparison between the profit from sales of different types of products. These charts are also useful to show periodic data.
- Line charts and area charts are mainly used for comparison in trends. They are best suited for visualizing time series data. For instance, if you wish to see how a particular product has performed in the market over the last 10 years, a line chart would provide the most insightful visualization.
- Stacked charts are also used to show comparison and composition together.
- If the insights required are to show a relationship between two variables, scatter plots are the best.
STEP 4: Saving & Publishing your dashboard
Once your dashboard is self- sufficient with the right insights and charts, click on the Save button on the toolbar. Since Power BI charts are built over Excel data, they shall keep updating as and when you update your Excel sheet.
You also get the option to Publish your dashboard to the Power BI service for sharing purposes.
Next Steps:
Congrats! You just created your first custom dashboard! Keep exploring and customizing your dashboards.
